
Infographics
The National Human Genome Research Institute (NHGRI) offers infographics to tell stories related to genomics using data visualizations. These infographics provide an easy-to-understand overview of each topic.

An infographic that explains why we need a new human pangenome reference.
An infographic that explains why it was so difficult to fully complete the human genome sequence.
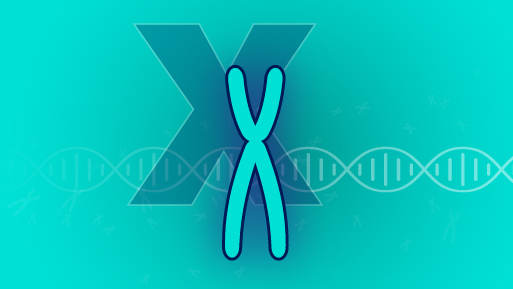
The X chromosome is part of sexual development and many other biological processes, including how some cats get their distinctive coat colors.
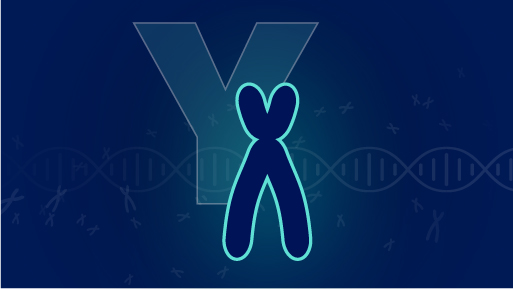
Among the 24 chromosomes that make up the human genome, the Y chromosome is unique for its highly repetitive structure. Scientists are studying the Y and its unusual features to better understand human health and disease.

The Your Genome & You infographic introduces the basics of genetics and genomics, and how the science impacts our lives.
Last updated: May 28, 2024